Analytics
The Analytics page is the high-level health view for a single bot. Use it to spot trends such as usage spikes, regional traffic, feedback balance, and token usage.
Open it from the bot’s left sidebar → Analytics (under Statistics).
For per-document drill-down (which pages get cited most), see Document Usage. For team-wide rollups across all bots, see Usage & Tokens.
Date range
A range dropdown at the top right defaults to Last 7 days. Pick a preset or set a custom range. Every card, chart, and table on the page respects the selected range.
The Refresh button next to the picker re-pulls the data without changing the range.
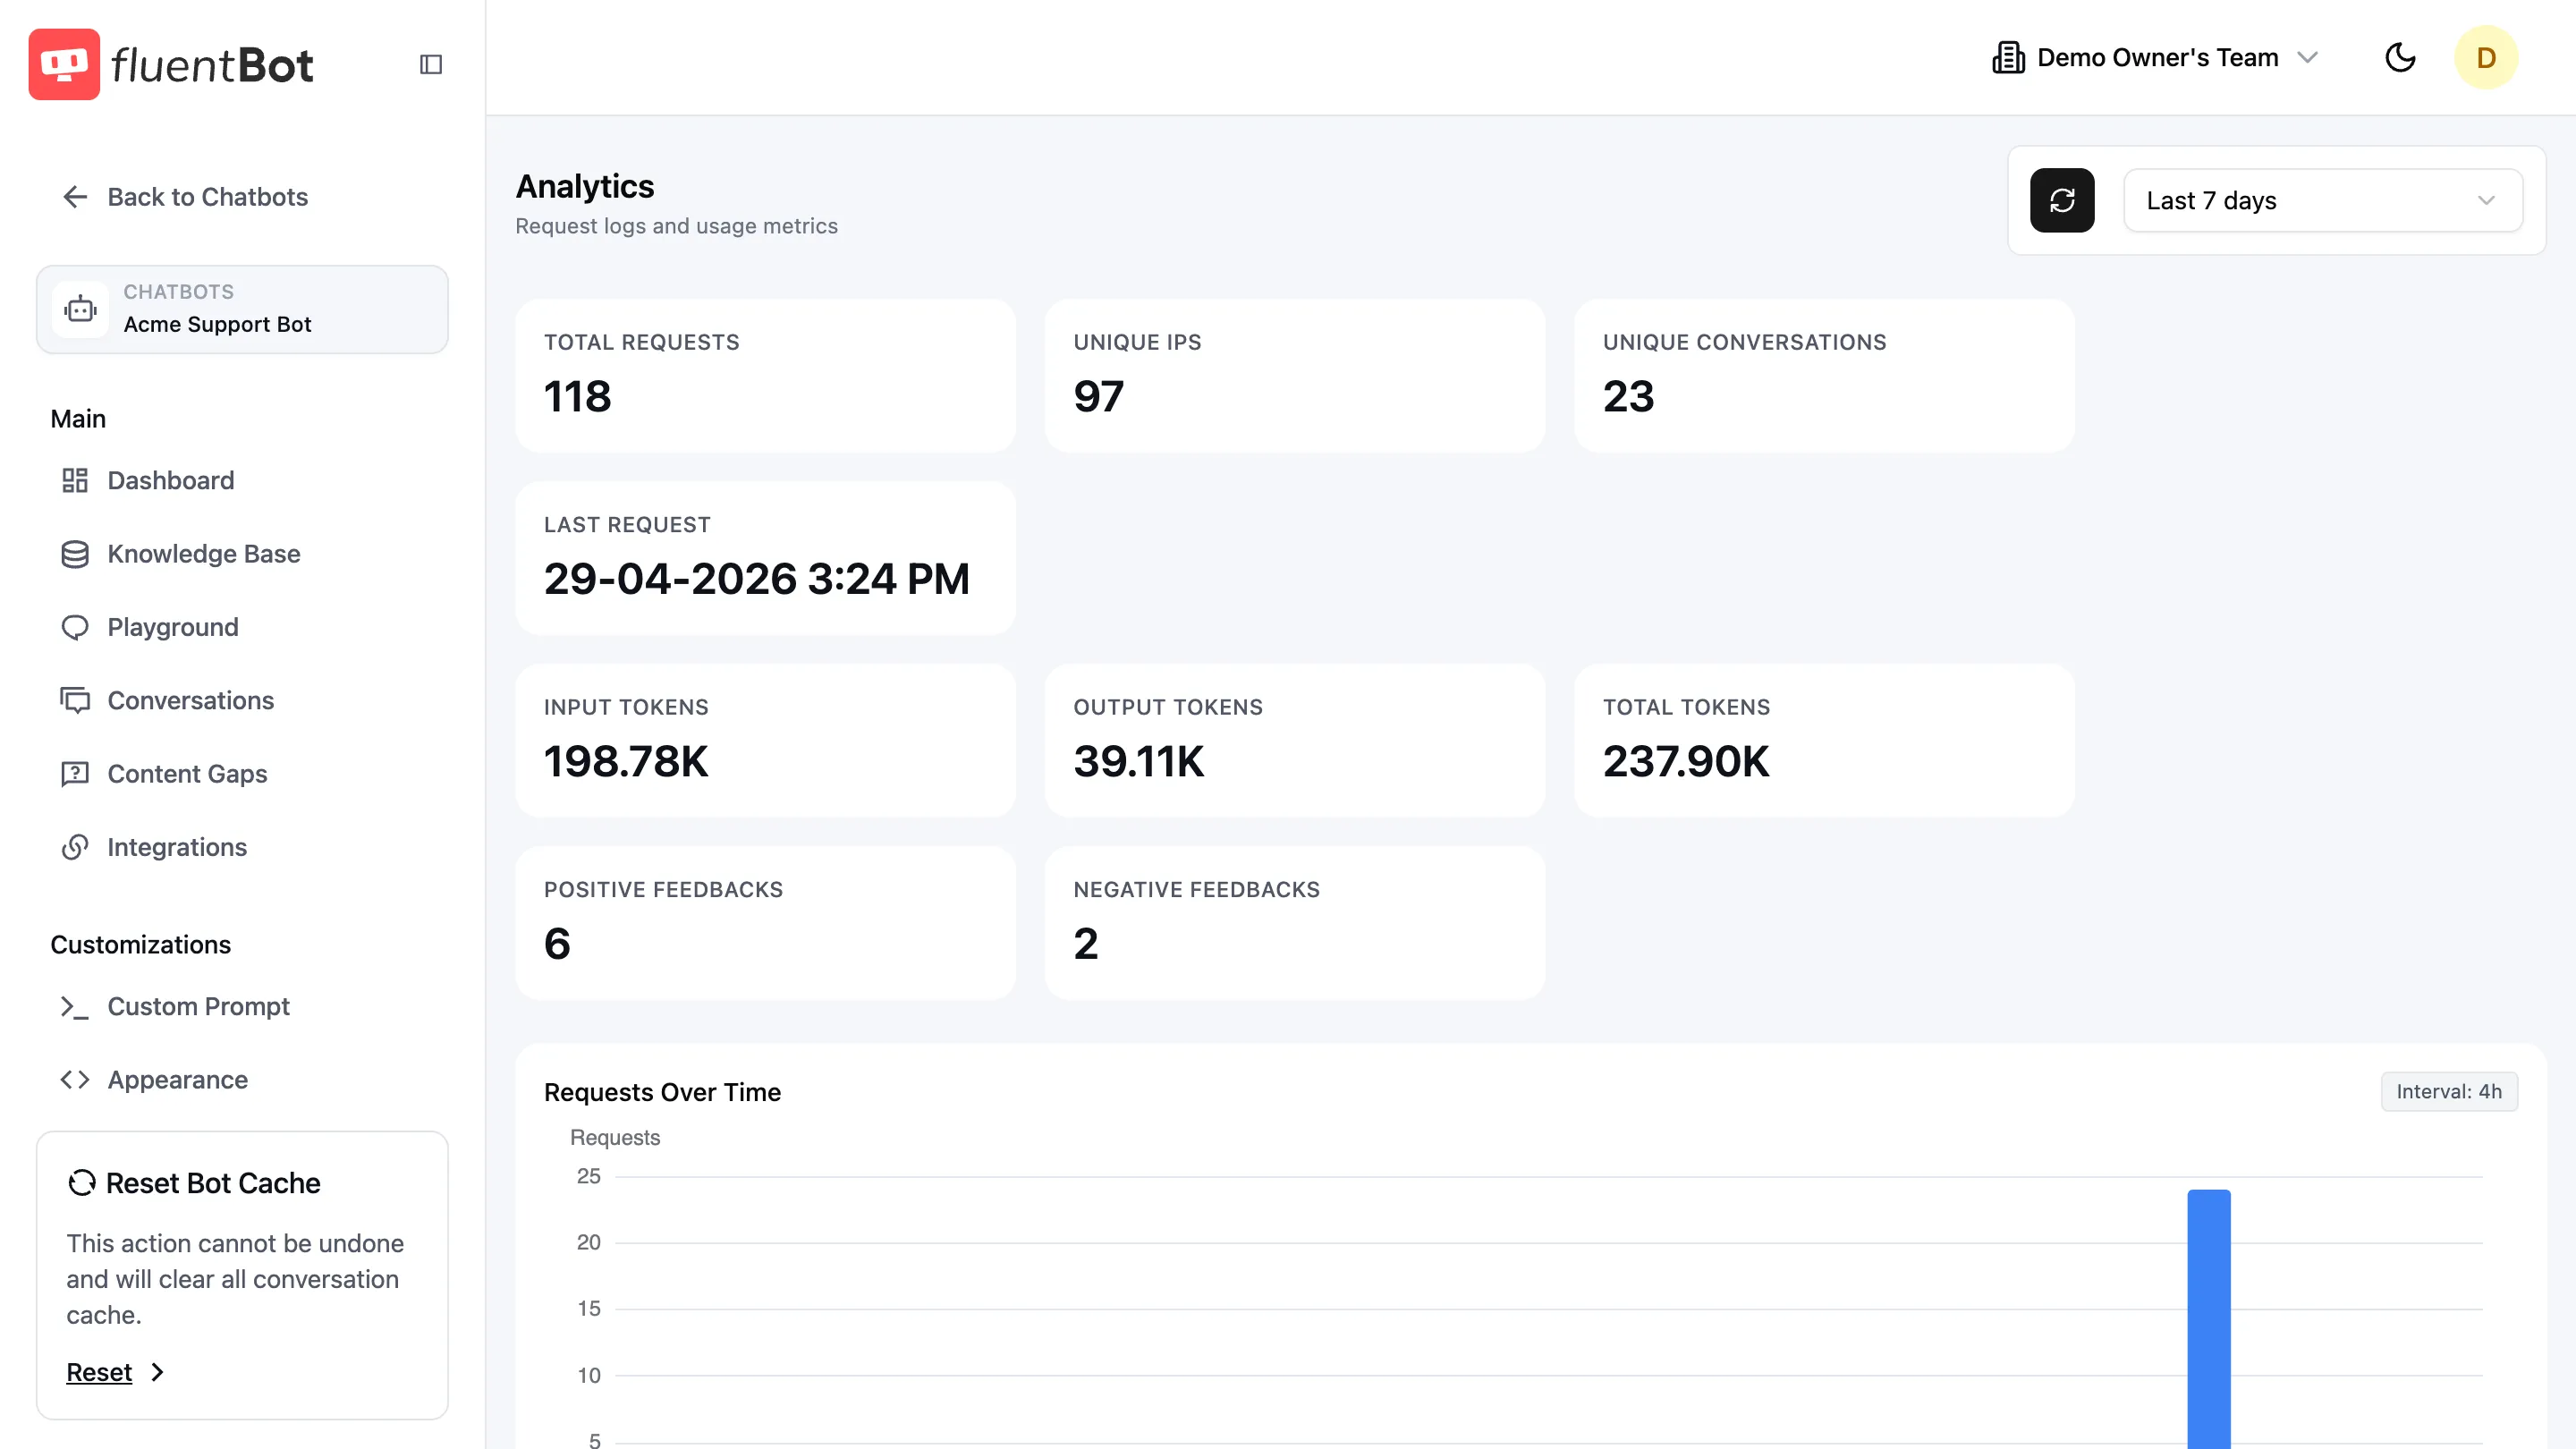
Stat cards
Nine compact metric cards across the top:
- Total Requests — API + widget calls in the range.
- Unique IPs — distinct caller IPs.
- Unique Conversations — distinct chat IDs.
- Last Request — timestamp of the most recent call.
- Input Tokens — total prompt tokens consumed.
- Output Tokens — total completion tokens generated.
- Total Tokens — input + output.
- Positive Feedbacks — thumbs-up reactions in the range.
- Negative Feedbacks — thumbs-down reactions.
Example: the demo bot below has enough traffic to show request volume, unique visitors, token totals, and feedback balance in one scan.
Charts
| Chart | What it shows |
|---|---|
| Requests Over Time | Bar chart of request volume. Bucket size shown next to the title (e.g. Interval: 4h). |
| Top Endpoints | Distribution by integration surface. |
| Top Countries | Geographic distribution by request volume. |
Requests over time
Use this chart to identify traffic spikes, quiet periods, and whether demand is spread across the selected date range or concentrated in one incident window.
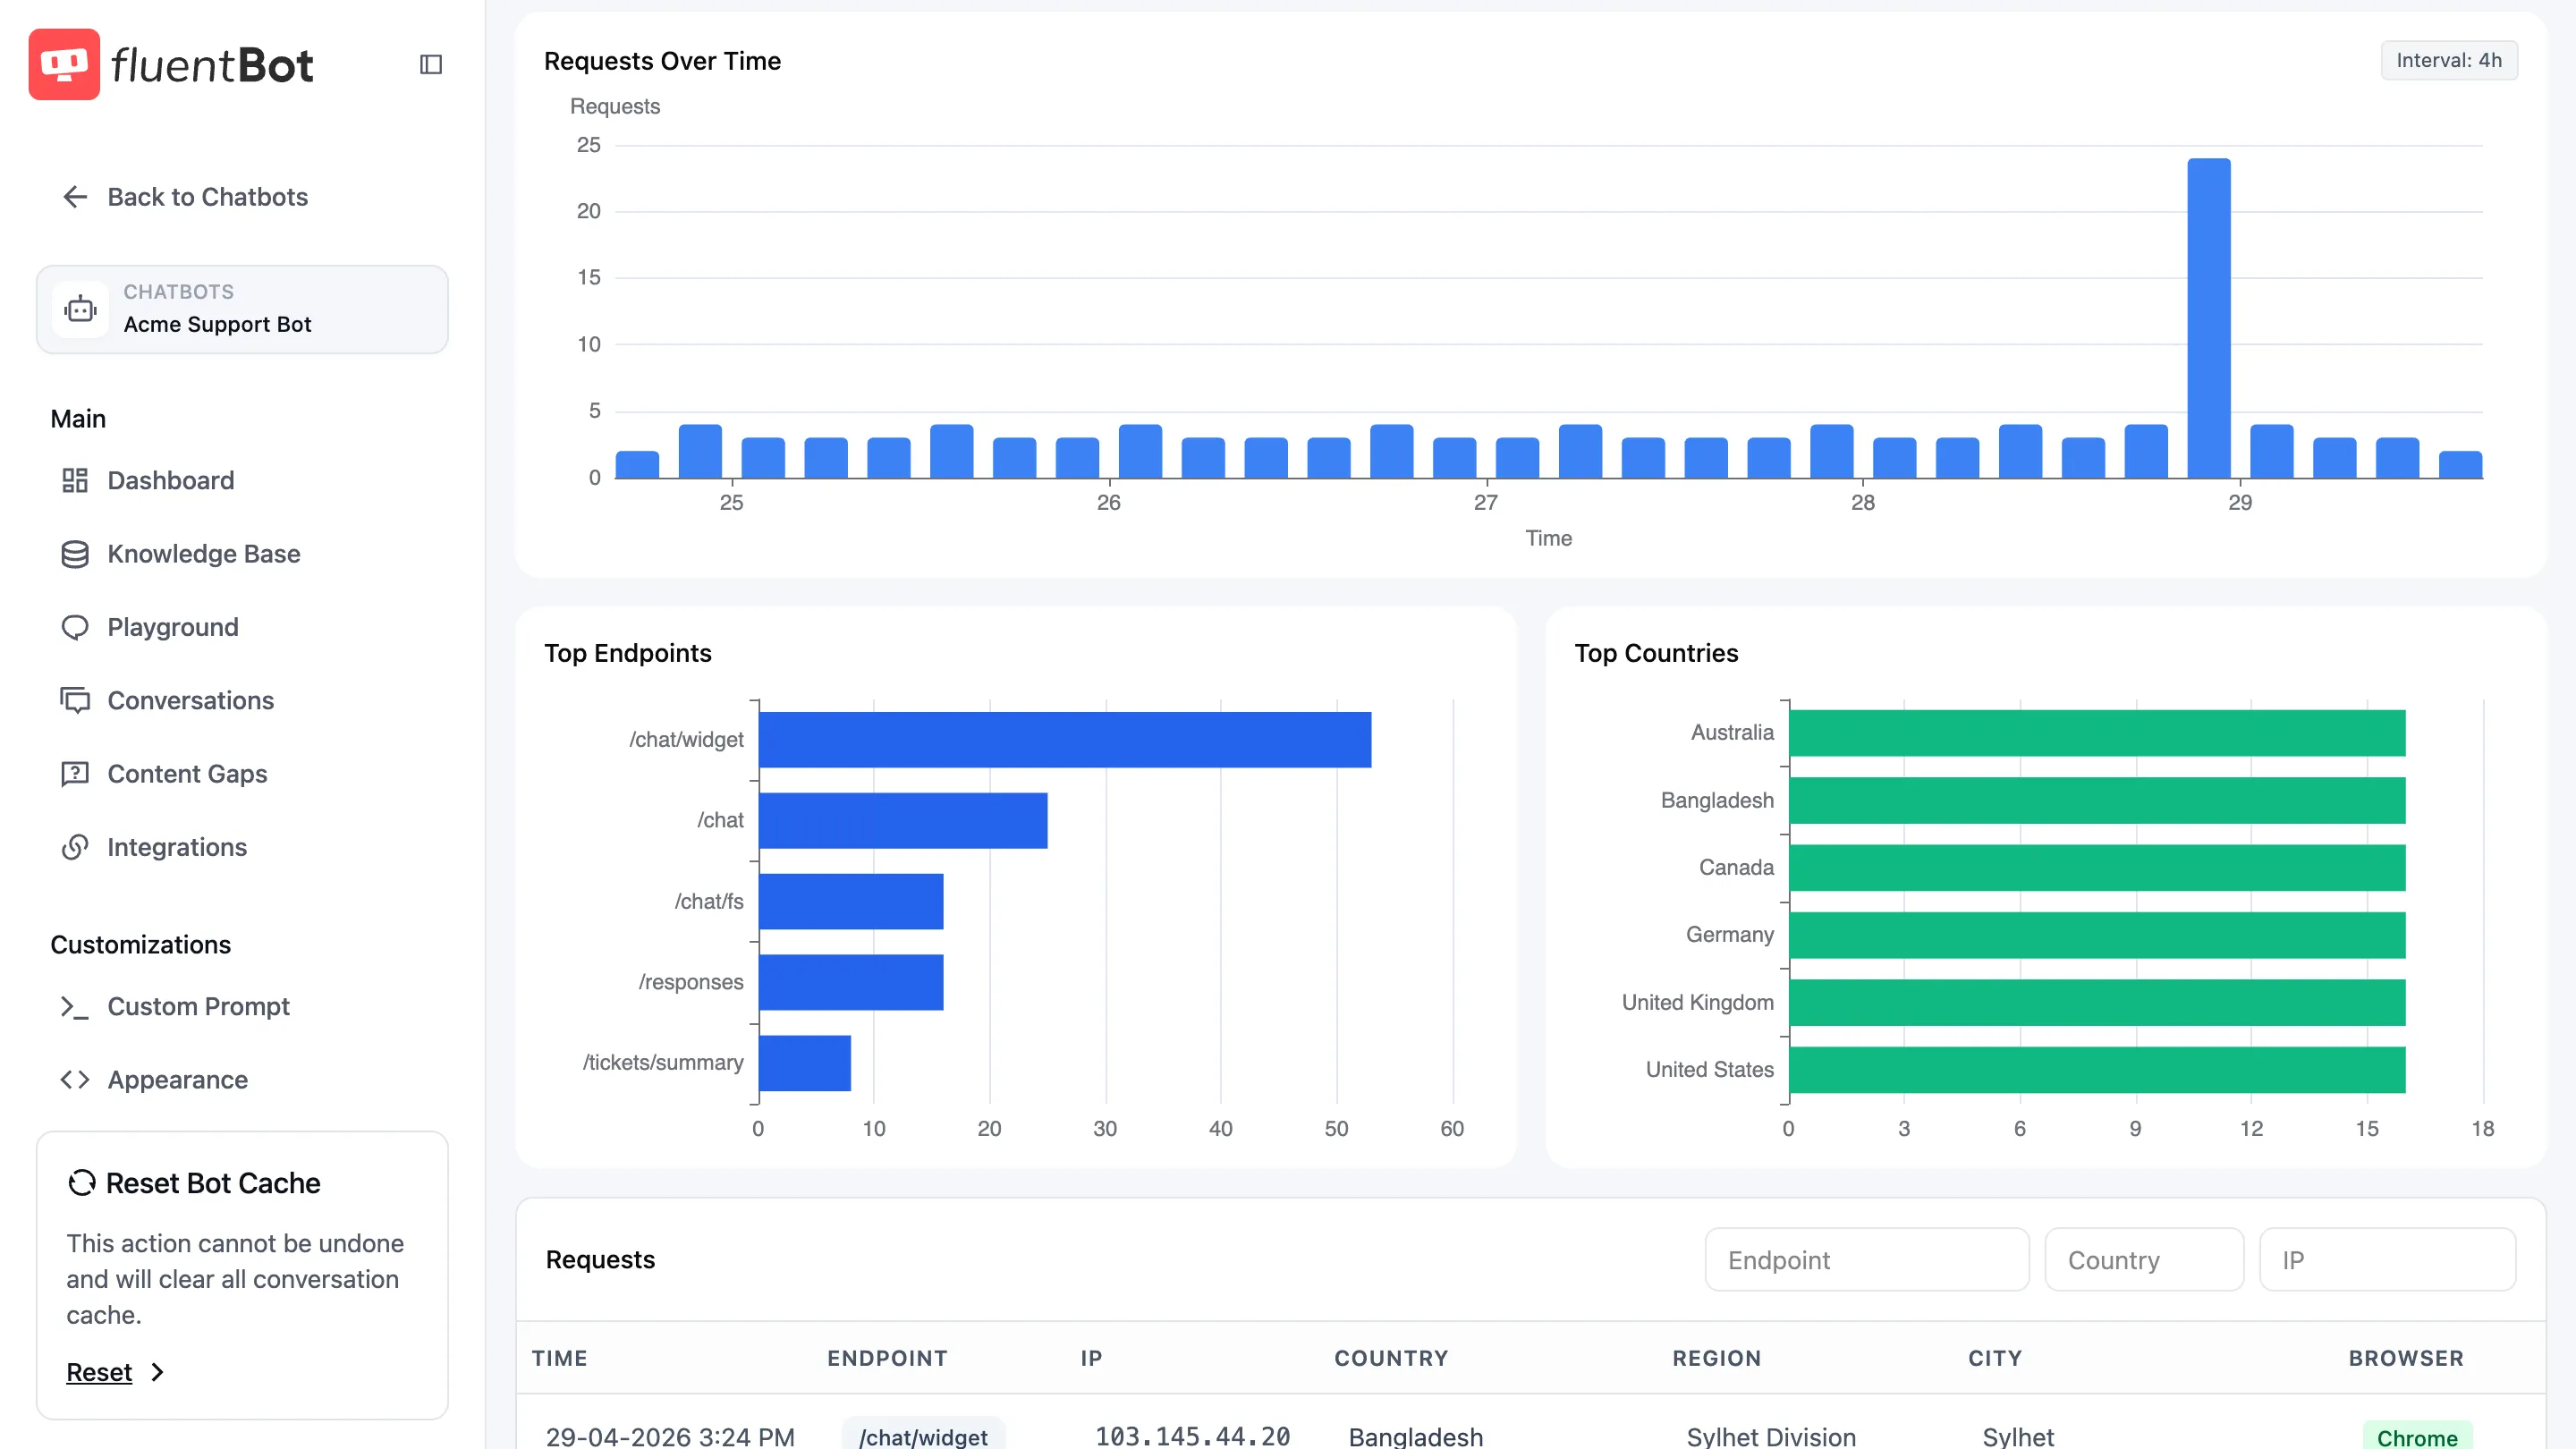
Endpoint and country distribution
Use Top Endpoints to see which product surface is driving traffic. Use Top Countries to confirm whether traffic matches your expected customer regions.
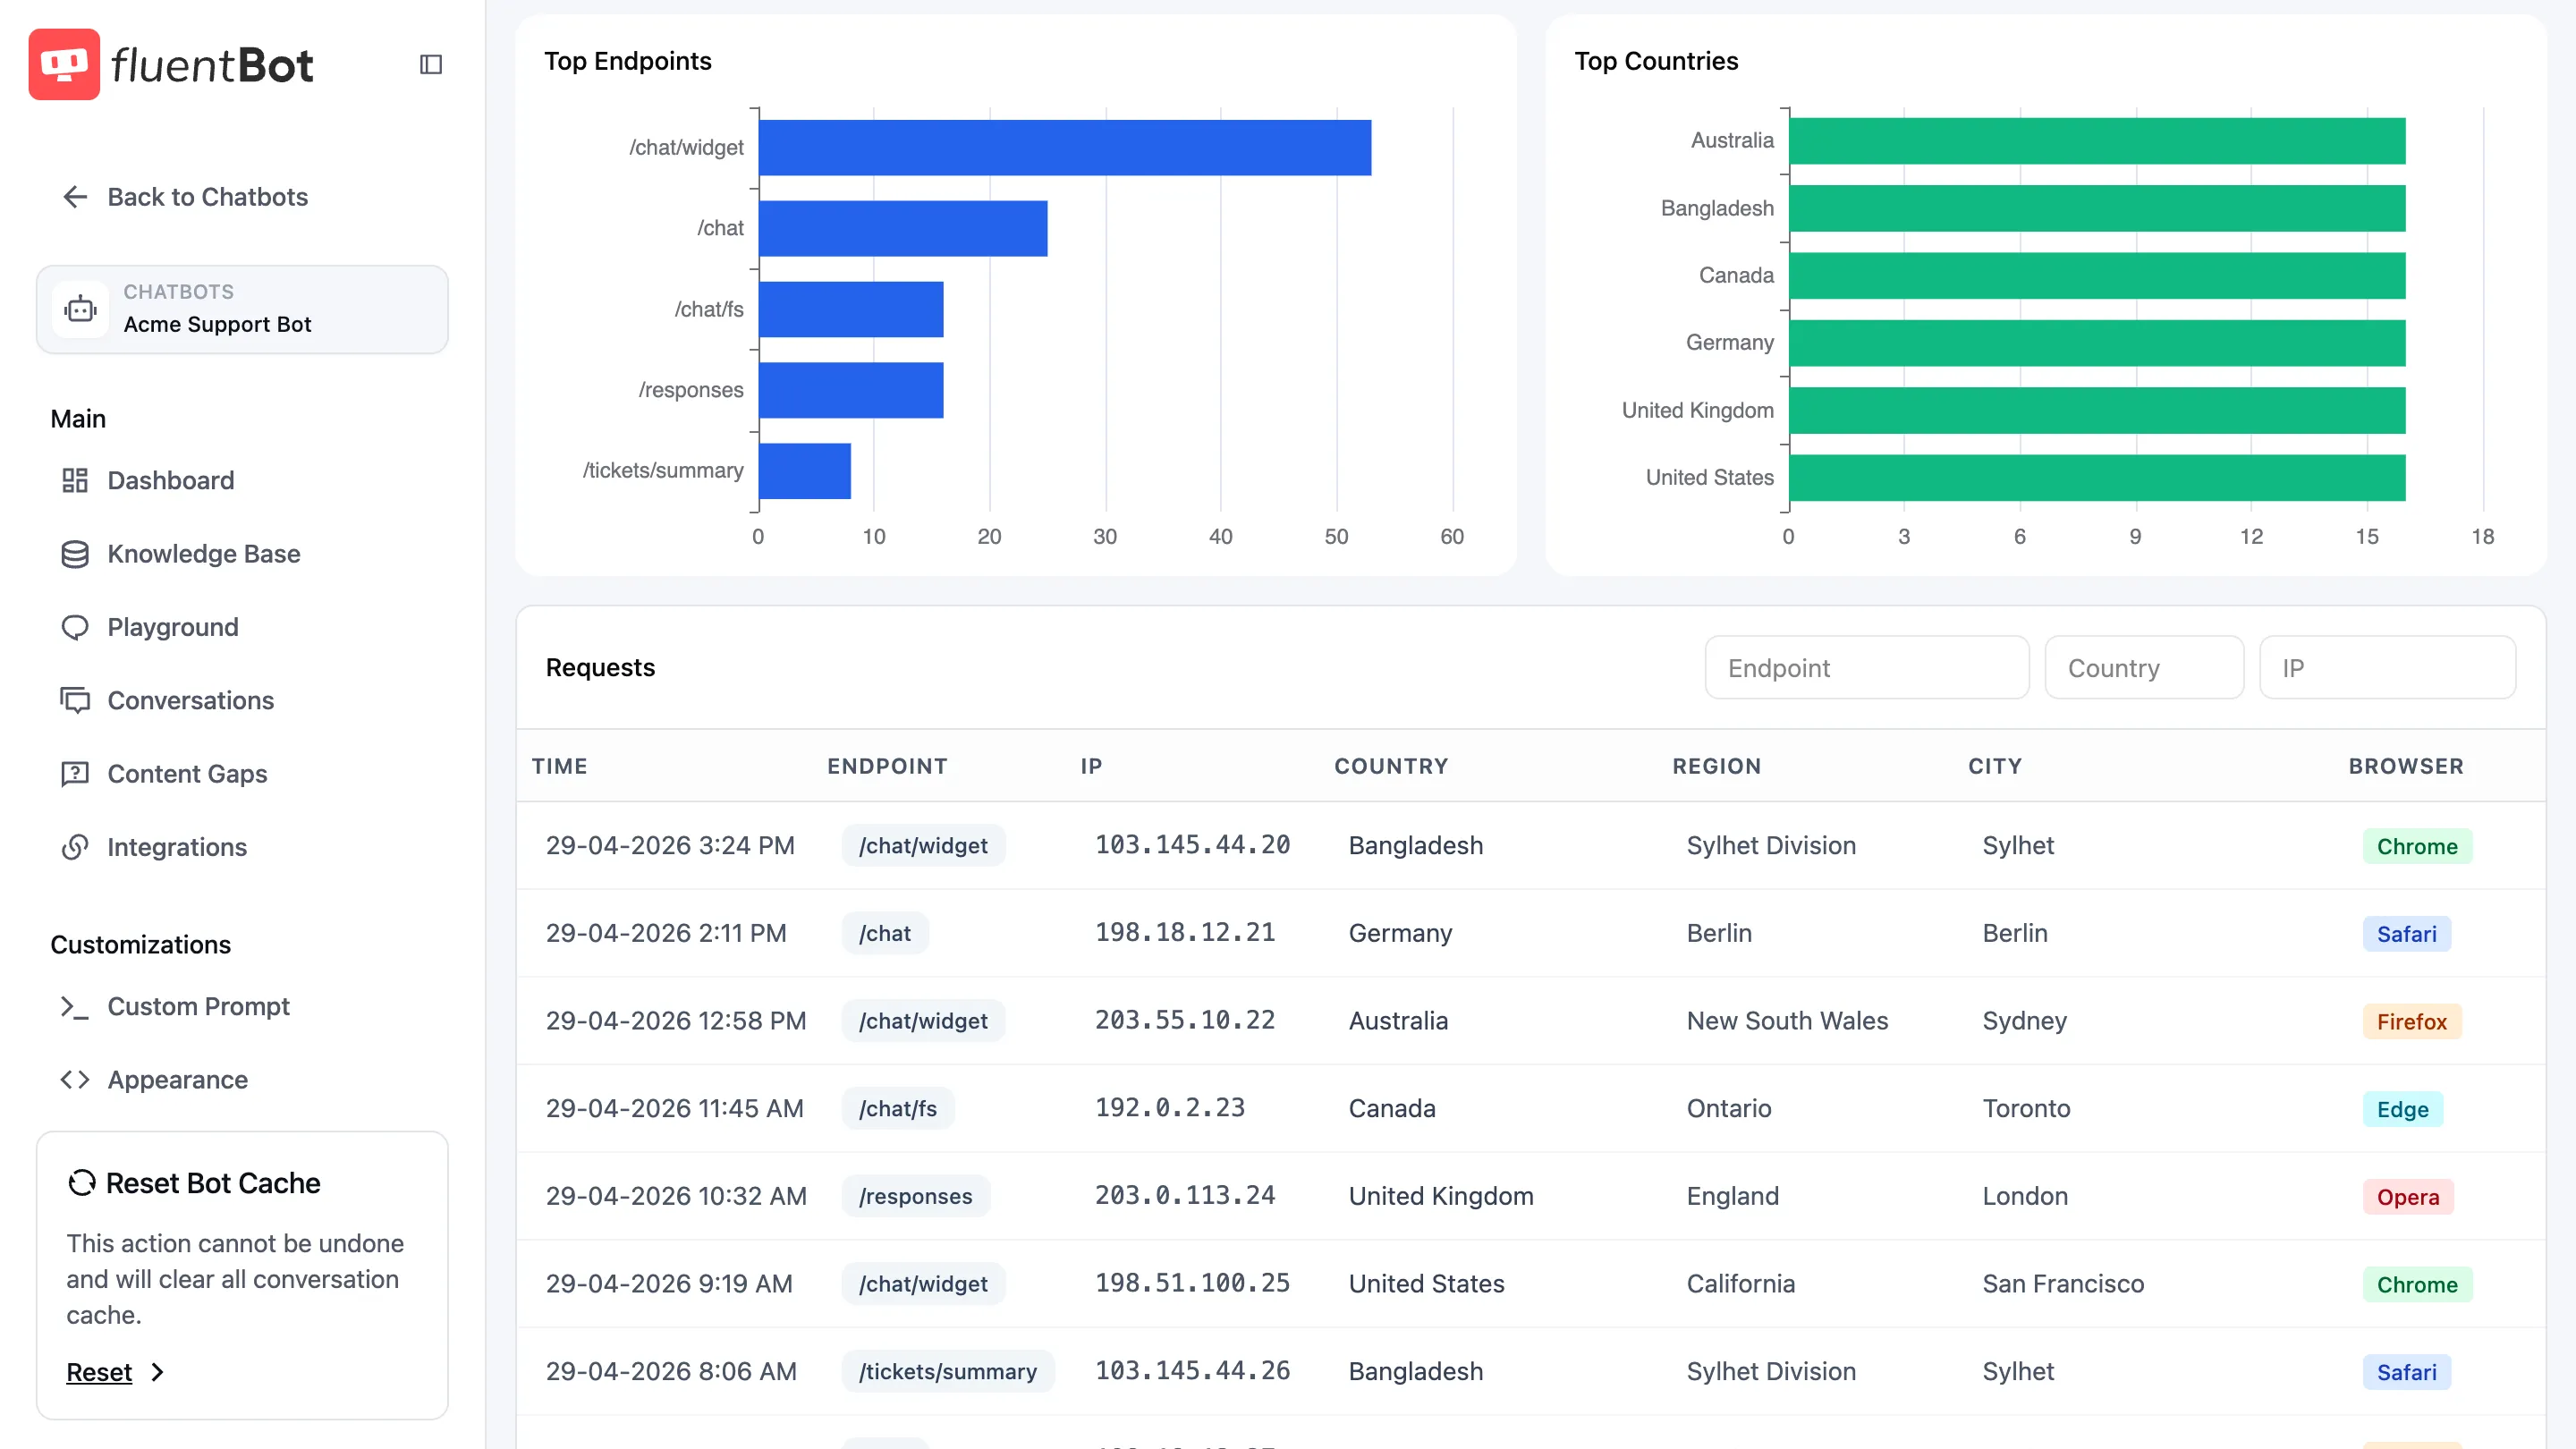
Tables
Requests
One row per request, with Time, Endpoint, IP, Country, Region, City, and Browser. Filter inputs above the table for Endpoint, Country, and IP. Use the Export menu to download all matching request rows for the selected date range and active filters as CSV or JSON.
Use this to investigate traffic patterns and unusual sources.
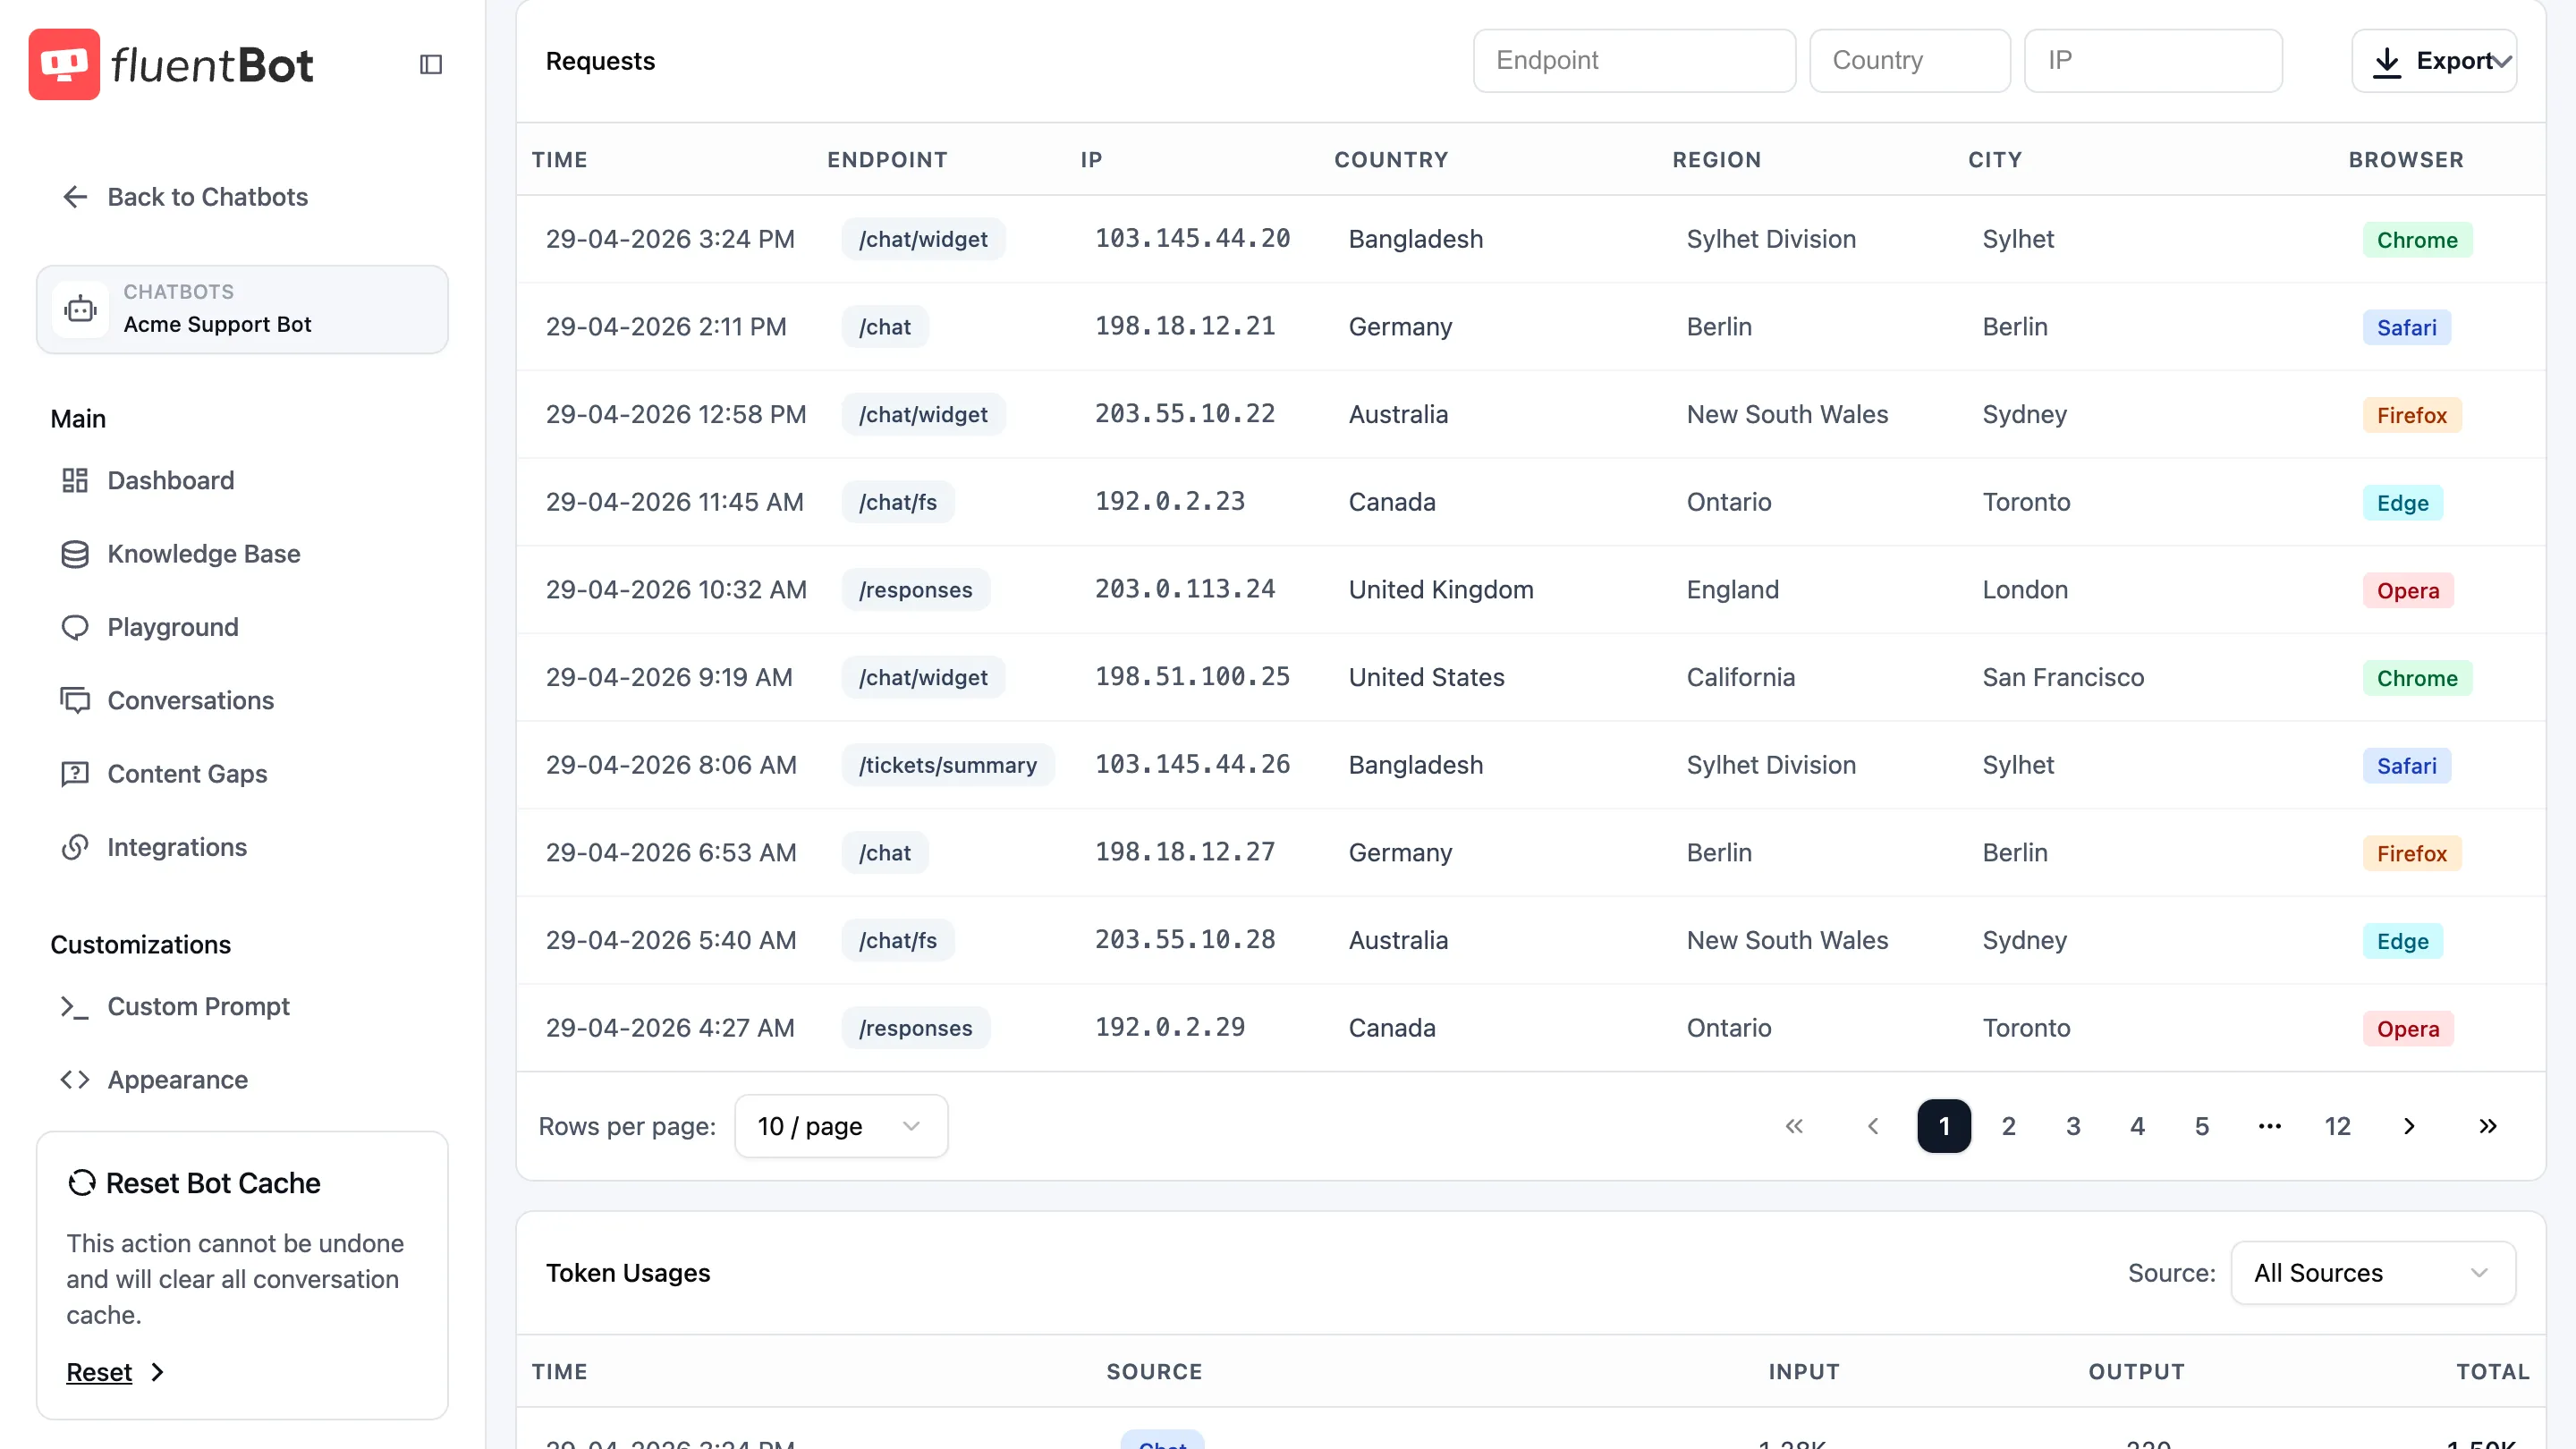
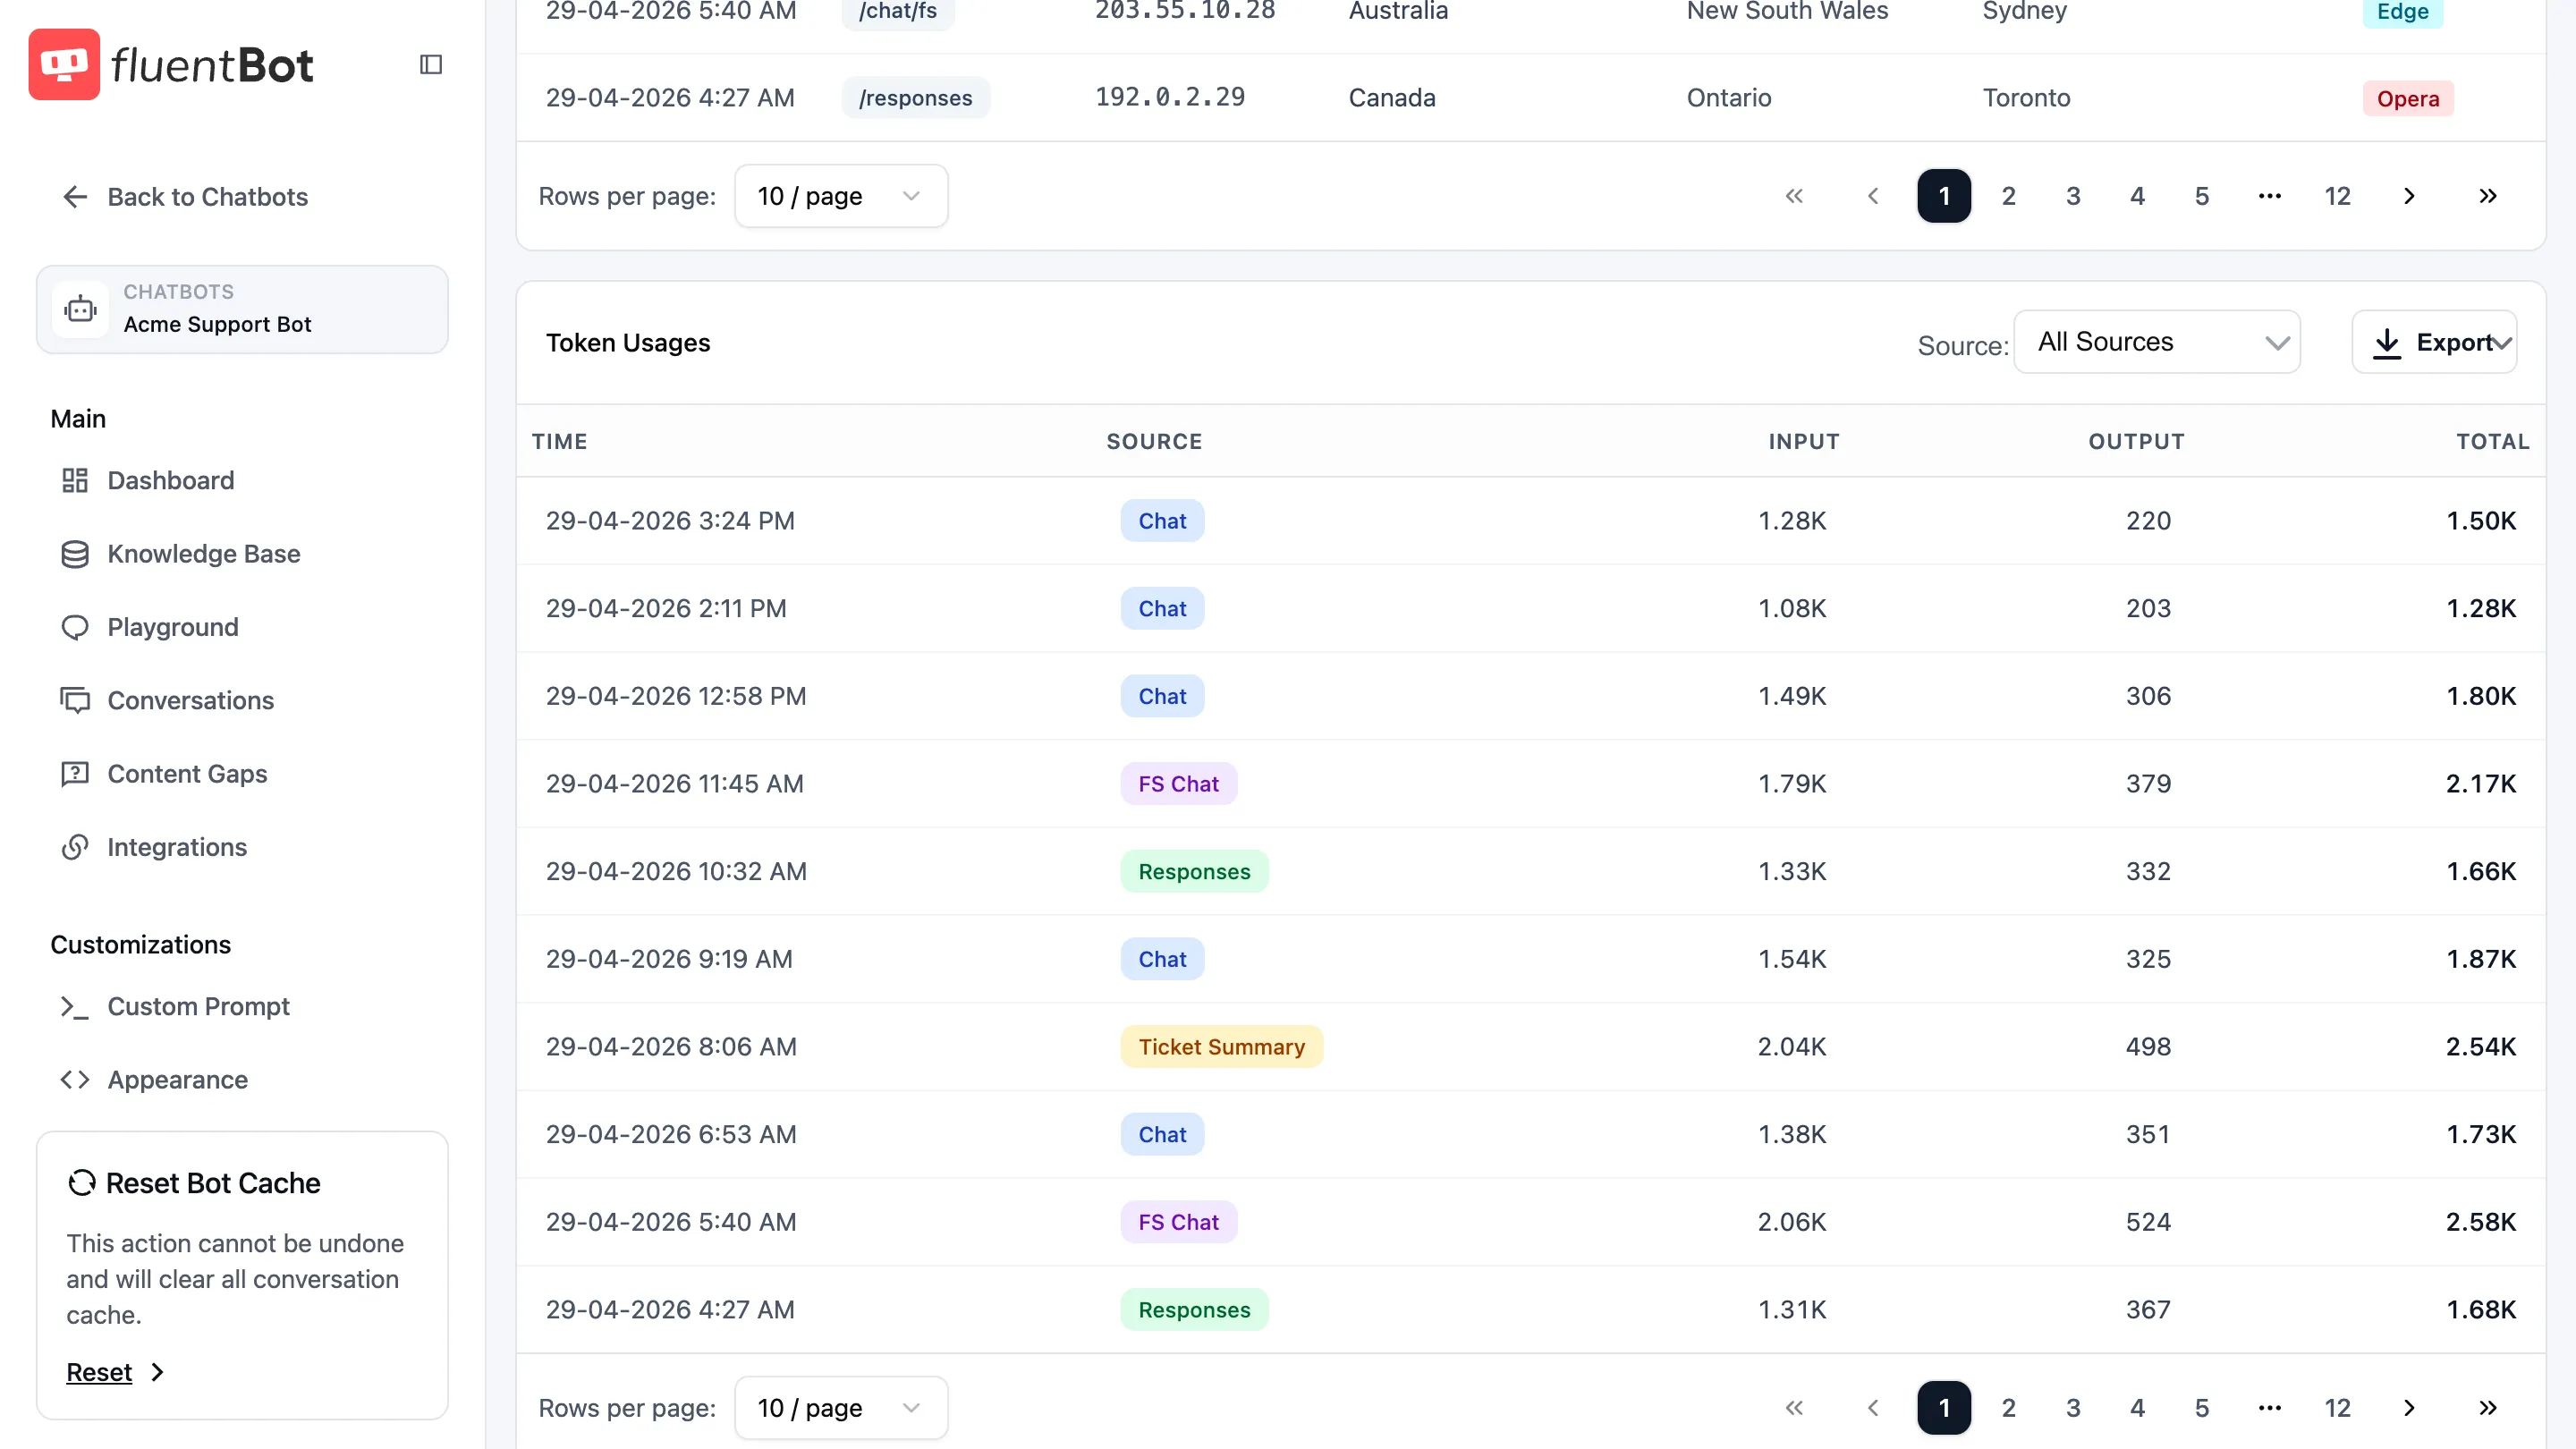
Token Usages
One row per AI usage record: Time, Source, Input, Output, Total. The Source dropdown filters by Chat, FS Chat, Responses, and Ticket Summary. Use the Export menu to download all matching token usage rows for the selected date range and source filter as CSV or JSON.
Use this table to compare token spend across chat, Fluent Support replies, Responses API calls, and ticket summaries.
Reading the page well
A few patterns that show up on this page:
- Spike in requests, flat tokens — visitors hitting the widget more but conversations are short. Probably good (clear answers, fast resolution).
- Tokens climbing faster than requests — answers are getting longer or visitors are asking broader questions.
- One country dominating — expected if you’re regional; worth noticing if you’re global.
- One integration surface dominates — confirm that matches how the bot is embedded or connected.
Export
Analytics supports two table-level exports in CSV or JSON:
- Requests → Export → Export CSV / Export JSON downloads request details including time, endpoint, IP, location, browser, timezone, and page URL.
- Token Usages → Export → Export CSV / Export JSON downloads token records including time, source, input tokens, output tokens, and total tokens.
Each export respects the selected date range and the table’s active filters. Pagination doesn’t limit the file; the downloaded file includes all matching rows.
Troubleshooting
- Charts empty — bot has no traffic in the selected range. Widen the window or check Conversations for activity.
- Numbers don’t match billing — Analytics and billing measure different things. Use Billing for plan limits and Analytics for bot activity.
- Traffic looks unusual — filter by date range, country, endpoint, or IP to isolate the pattern.
What’s next
- Document Usage — drill into which documents drive the answers.
- Conversations — see the actual chats behind the volume.
- Usage & Tokens — team-wide token rollups across all bots.